
That’s why we’ve put together this guide for how to benchmark your YouTube analytics: so you can get a better sense of what’s working and what isn’t!
YouTube Benchmarks
We know that you want to grow your YouTube channel and make money from it. That’s why we created this guide to help you understand the performance of your videos, so you can create more engaging and interesting videos of what campaign works and less of what doesn’t
How to use YouTube Analytics?
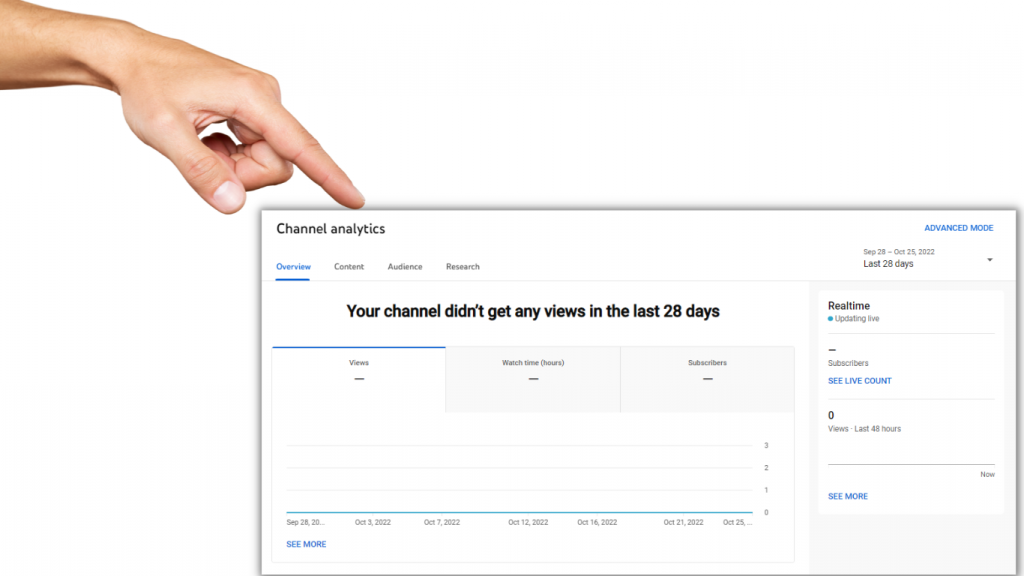
1. Log in to your YouTube account and proceed to YouTube Studio.
2. Click the “Analytics” so that you can be directed to its page.
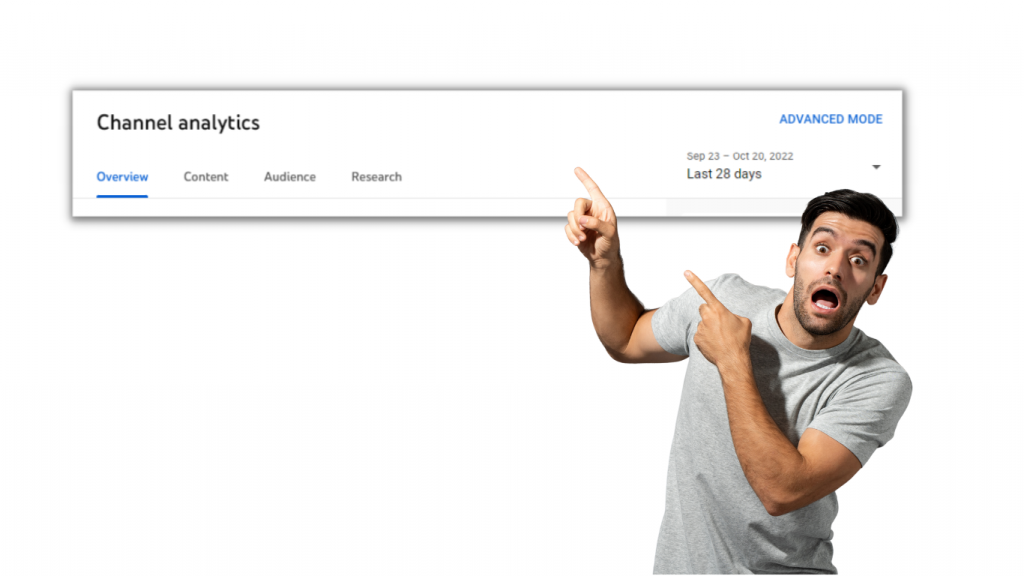
3. You can check an overview of the performance of your channel and videos under the Overview tab. Your views, watch time, subscribers, and expected revenue (if you’re a member of the YouTube Partner Program) are all displayed on the key metrics card.
Note: Reports for the following can be seen in this tab:
- Typical performance
- Your top content in this period
- Realtime
- Stories
4. The Content tab provides you with an overview of how your audience discovers your content, what they are watching, and how they engage with it.
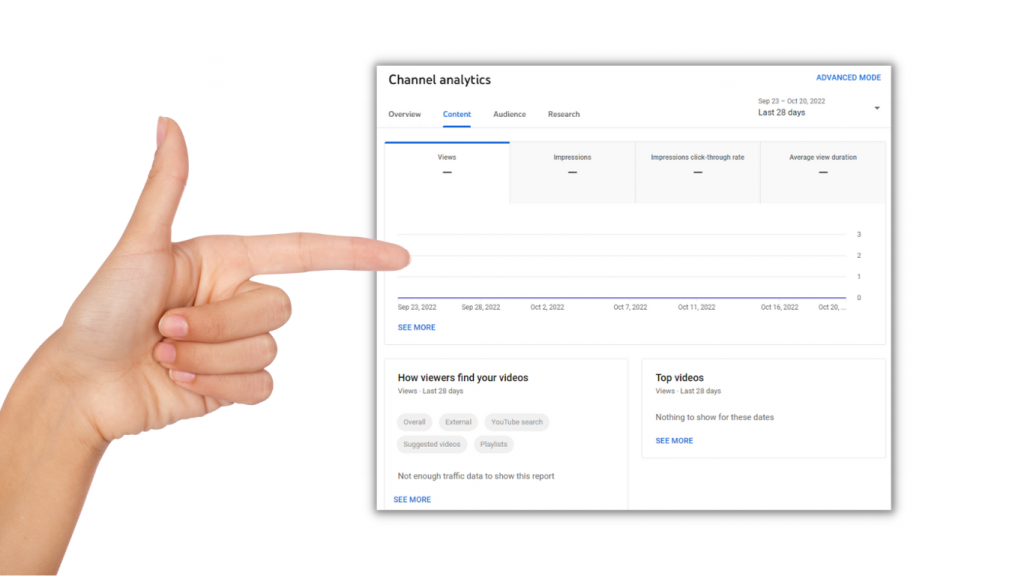
Note: You can view the following reach and engagement metrics reports within all Videos, Shorts, Live, and Posts tabs:
- Views
- Impressions and how they led to watch time
- How viewers found your content/videos/Shorts/live streams/ business
- Key metrics card
- Key moments for audience retention
- Top videos/Shorts/posts
- Remixed
- Post impressions
5. You may get an overview of the kind of viewers who watch your films on the Audience tab. The important analytics card displays your unique viewers, subscriptions, returning and new viewers, and total members.
6. Your audience’s search terms as well as those of YouTube viewers worldwide are summarized on the Research tab.
What are YouTube analytics metrics?

YouTube Analytics metrics are the data that YouTube collects about your channel report and stats, like how many people are watching your videos in YouTube and when they’re watching them.
Why is this metric important?
YouTube Analytics metrics are important to be calculated because they help you understand what your audience is looking for, where they’re coming from, and how many people are actually watching your relevant videos.
How to calculate the YouTube engagement rate?
If you’re looking for a way to gauge how well your channel is performing, look no further than the YouTube engagement tab. The engagement tab will give you details about your channel’s interactions with its audience. Some of the core metrics used here include:
- Likes/Dislikes
- Comments
- Shares
- Users Change
Tips on benchmarking your analytics
1. Make sure you’re using a reliable source to track your progress for example the ads, average view rate and quality score.
2. Start by looking at your channel’s total views, likes, dislikes, and comments as well as how many subscribers you have in YouTube industry.
3. Check how often your videos are being shared on social media sites like Facebook and Twitter as well as on other video-sharing platforms like Dailymotion or Metacafe.
4. Analyze how long it takes for each video to reach a 100% completion rate with average engagement per view (i.e., likes, dislikes, shares). The higher this number is, the better!
5. Compare these numbers against those of similar channels in your niche (based on category) to see if there are any trends emerging over time that might be worth emulating!
Attraction metrics
Channels allow you to see when your audience is watching, what they’re watching, and how long they spend watching it. This data can help you determine which videos work well for your audience, and which ones don’t.
You can also use channels to find out where people are coming from when they come across your video. This allows you better to target your leads , audience or competitors by using demographic information from Google Analytics.
How to improve your videos using traffic sources?
Youtube videos
If you want to improve your YouTube videos, you need to think about where traffic is.
There are a lot of ways to get traffic, but one of the most effective ways is to use traffic sources. These are channels that will send people directly to your video and help it spread faster world wide. More options for marketing strategy of traffic sources include Twitter, Facebook, Reddit, YouTube itself (if you’re posting a new video), and even Instagram or Snapchat.
One way to improve your videos is by adding keywords related to what they’re about in the title and description fields of each video ad. This will help people find them when they search for those terms on Google or other search engines, which will bring more viewers.
How to improve your videos using “impression click-through rate”?
We’ve all heard the old saying: “A picture is worth a thousand words.”
But if you’re looking to improve your videos, you should know that an impression is worth a thousand impressions.
That’s right! It’s not just about how many people see your video or access your videos, but how often they see it. And the impression click-through rate (CTR) is a useful metric for measuring that.
Average CTR is the percentage of times that people saw your ad and clicked on it. An impression CTR of 10% means that 10% of the people who saw your ad actually clicked on it. This indicates that your ad measure enough to get people interested enough to click on it. And if you can get a higher CTR by making small changes to your ad, then those changes will have a large impact on its effectiveness.
Best YouTube analytics tools
Here are some of the best YouTube analytics tools:
Social Blade: Social Blade is a great tool for understanding how much money you could be making from YouTube ads. It also lets you know how many views have received over time, so you can see if any of your content is getting more views than usual. This can help you decide whether or not it’s worth continuing to make that type of video in the future!

VidIQ:VidIQ analyzes all of your videos and provides actionable insights about what’s working well (and what isn’t) with each one. You can also use this tool to identify other similar videos on YouTube that might be relevant for targeting audience—and see how they’re performing! The insights will help guide your next video creation process by showing you which types of videos tend to perform better than others in terms of conversions (e.g., clickthrough rates for more ads).

Industry Cost

Industry costs on YouTube Analytics are high in the United States. The average cost of a YouTube ad is $2.55 per 1,000 impressions (CPM), and the average cost per click (CPC) is $0.34.
This means that for every 1,000 views of your video, you can expect to pay $2.55 for those views and get about 3 people to click on your ad (if you’re paying per click).
Youtube Ads

When it comes to YouTube ads, many people are familiar with the Google Ads platform. However, did you know that there is also a separate platform for managing your YouTube ads?
This is called Benchmark. It’s actually a very powerful tool that can help you find the best ways to grow your channel and make money from it.
In this video, we’ll go over what Benchmark is and how you can use it to make your channel more successful.
Key takeaways
We’ve got some key takeaways on how you can benchmark your YouTube analytics data.
1. You should always be checking in on your metrics and stats
2. This is the best way to see how well your channel is doing and where it needs improvement.
3. It’s important to keep tabs on how many views, subscribers, and watch time you’re getting every month or even past year so that you can plan for future growth and success!


